The Local Meteoric Water Line and Stable Isotopes
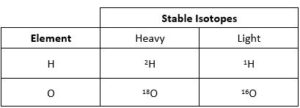
Stable Isotopes
An isotope represents one or more variations of the same element. Most people are familiar with radiogenic isotopes, such as 14C used to date artifacts. Radiogenic isotopes are unstable such that they decay over time. However, did you know that there are also stable isotopes that do not decay? For example, carbon has 2 stable isotopes, 12C and 13C. 13C is heavier than 12C because it has an extra neutron. Therefore, we call 13C the heavy isotope and 12C the light isotope of carbon.
Hydrogen and oxygen also have multiple stable isotopes. For this project, we will be focussing on the light hydrogen isotope 1H and the heavier stable hydrogen isotope 2H (or deuterium), along with the light oxygen isotope 16O and the heavier oxygen isotope 18O.
Stable Isotopes of Water
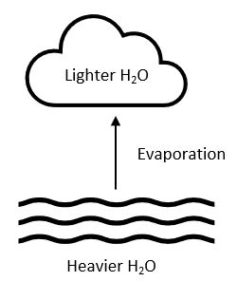
Compounds like water (H2O) can contain heavy and light isotopes.
![]()
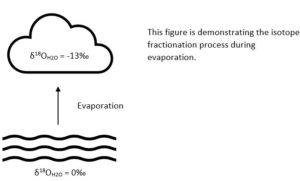
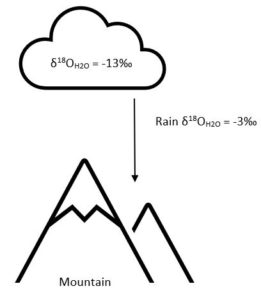
Lighter H2O molecules evaporate faster than heavier H2O molecules. Such that clouds will contain fewer heavier H2O molecules than the water body they evaporated from.
Reporting Stable Isotope Values
Since some processes change the relative amounts of heavy to light isotopes. When we report the stable isotope value of an element, we use the isotope ratio of heavy to light. For example 2H/1H for hydrogen and 18O/16O for oxygen. Also, while reporting the stable isotope value of a sample, we compare its isotope ratio to the ratio of a known standard. For example, for H and O stable isotopes, we compare or normalize the precipitation sample values to ocean water as follows:
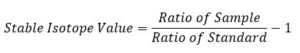
More specifically:
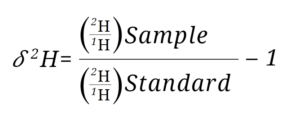
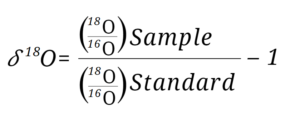
Where 𝛿2H is the notation used and is pronounced like this: “delta H 2”, or “delta O 18”. The isotope ratio of the sample is normalized to the standard by dividing the sample isotope ratio by the standard isotope ratio and subtracting that fraction by one.
Permil (‰)
The stable isotope equation results in a very small number, so we multiple the 𝛿 equations by 1000 to put the 𝛿 values in units of permil. Permil is just like a percent, except instead of multiplying a fraction by 100, we multiply it by 1000. Such that the actual equations used to calculate the stable isotope values are:
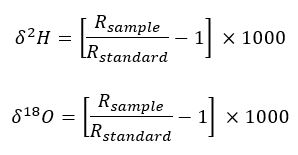
Where R represents the stable isotope ratio of 2H/1H for hydrogen and 18O/16O for oxygen.
The 𝛿2H and 𝛿18O of Ocean Water
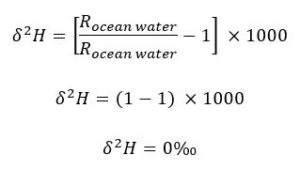
Ocean water is the standard that we use in the above calculations. Such that the 𝛿2H and 𝛿18O values of ocean water are 0‰. You can see how this is by substituting the R of ocean water into the 𝛿2H equation above as both the sample and the standard:
Stable Isotope Values of Water Samples
Water samples with more of the heavy isotope (2H and 18O) than in ocean water have positive 𝛿 values. Conversely, water samples with less heavy isotope than ocean water have negative 𝛿 values. Therefore, evaporated water will have a more negative value than the reservoir of water it evaporated from.
Precipitation favours the heavy isotopes, such that the precipitation 𝛿 value is less negative compared to the 𝛿 value of water in the cloud.
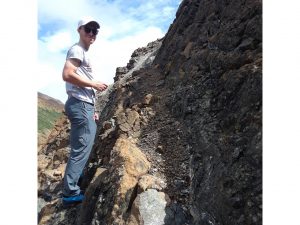
The 𝛿2H and 𝛿18O water is dependent on both latitude and temperature, meaning that a water sample from a low-latitude, generally warm climate such as an island in the Caribbean Sea will have very different 𝛿 values than a water sample taken in Newfoundland. These variations can occur in an area as small as the island of Newfoundland itself, which is why it is important to examine samples across the entire geography.
Meteoric Water
Meteoric water is all water that comes from precipitation. This includes snow, rain, hail, and drizzle.
The Global Meteoric Water Line (GMWL) was discovered in 1961 by Harmon Craig. This is a linear relationship between the stable hydrogen (𝛿2H) and stable oxygen (𝛿18O) isotopes of water from around the world. This simple linear relationship follows the standard equation of a line (y=mx+b; put into context of the project gives: 𝛿2H=8*𝛿18O+10) and generally holds for any water that has been in recent contact with the atmosphere (aka meteoric water)
Subsequent research has shown that the GMWL is the weighed average of Local Meteoric Water Lines (LMWL). LMWL’s can have a different slope and intercept values compared to the GMWL, providing valuable geochemical and hydrologic data for a specific geographic location. Many areas have developed their own LMWL; however, one has yet to be generated for Newfoundland and Labrador.
LMWL’s can be used in several geoscience applications such as determining the origin of groundwater, tracing local relative humidity, studying local climate, or as a tracer of climate change.
Project Checklist and Guidelines
Goals
The goal of this project is to gather precipitation samples across the island of Newfoundland, with one common thread that links all methodologies and is paramount to gathering great data: avoiding evaporation. Evaporation, much like latitude and temperature, changes the isotopic ratios in a sample, so it is important to minimize evaporation during sampling.
Not to worry – this is a simple and straightforward process that starts at the time of sampling and continues through to storage of the samples. To reduce evaporation:
- Use fresh precipitation – sampled immediately after precipitation (i.e., snow) or during precipitation (i.e., rain) as soon as safely possible.
- Work quickly. Gather the sample and seal the bag, removing as much air as possible.
- Keep the sample in a cool, dark location until it can be transferred from the collection bag to the glass vial. Access to a refrigerator is useful, but not required.
- Fill the sample vial until it is nearly overflowing before putting on the cap. If there are any air bubbles in the sample, try to fill it again without air bubbles.
- Ensure the lid on the vial is securely closed.
- Store the vials in the refrigerator (if possible) until it is time to ship them to Memorial University.
Timeline
For this project, you will ideally gather four sets of precipitation samples throughout 2021 – one for each season. The timeframe for each season is as follows:
- Winter: Until March 20, 2021
- Spring: March 21 – June 20, 2021
- Summer: June 21 – September 22, 2021
- Fall: September 23 – December 21, 2021
Sample Location
There are a few basic guidelines to follow while selecting your sampling location. When selecting a location, keep in mind:
- A location that is at least partially sheltered. Avoid seaside areas or open fields (wind increases evaporation).
- Away from high traffic areas including roadways, sidewalks, or pathways. This will help to reduce debris in the sample.
As part of your data collection, please indicate the exact sampling coordinates using Google Maps. At the end of the project, we will create a visual map of sampling locations across the island. To get exact location details, utilize Google Maps on your smartphone or desktop:
Apple iOS

Android OS

Desktop

We will compile all Plus Codes/sample locations at the end of the data collection portion of the project and share it with all participants.
Weather Data & Planning Ahead
Staying on top of weather forecasts will allow you to plan a date and time to gather your sample.
Safety First! Samples should be collected during a precipitation event, but not during a storm.
To gather the required weather data to accompany your sample, take advantage of the Environment Canada weather database. They have a mobile app for iOS and Android, along with a desktop site. App details are as follows:
WeatherCAN for iOS
WeatherCAN for Android
The following data are required for each sample (at the time of sample collection):
- Type of precipitation (rain, snow, hail)
- Outdoor temperature (including wind chill/humidity alterations – the “feels like” temperature)
- Wind speed and direction in km/h
- Relative humidity
- Outdoor conditions (rain, snow, drizzle, fog, cloud cover, sun, etc.)
Take advantage of your smartphone and take a screenshot of the weather conditions for easy reference when filling in the data sheet.
If using a smartphone not an option, all data can be collected from the Environment Canada website. Make sure to use the appropriate location when gathering weather condition data.
Materials
Most required sampling materials will be provided for you, along with prepaid return postage. Kits will include:
- 4 x large zip-top bags (to collect samples)
- 10 x glass vials
- 1 x plastic syringe (to transfer liquid into vials)
- 2 x prepaid Xpresspost envelopes
- Return shipping materials and instructions
- 4 x small zip-top bags
- 10 x individual bubble envelopes for vials
- 2 x absorbent pads
Not supplied, but would be useful:
- Two clean, 2L plastic pop bottles (will be transformed into a catchment device for rain)
- Access to a smartphone for location and in-situ weather data (this is optional, as all data can be collected on a computer right after sampling – we will provide instructions for both).
Collecting Snow Samples
If there’s snow in the forecast and windspeed is forecasted to be relatively low, it’s time to start planning for sample collection.
- Set aside two large zip-top bags to be used for collection. Be sure to label your bags for easy reference.
- Once the snow has accumulated on the ground, make your way to the sampling location.
- Check the area to ensure that it has not been walked on or contaminated with debris.
- Fold-down the edges of the bag to avoid getting snow stuck in the zipper area.
- Using the bag or a scooping device, skim the surface of the collection area, adding snow to the bag until it is 1/3 to 1/2 full.
- Close the bag and gently squeeze out as much air as possible.
- Store the sample away from direct sunlight in a cool, dark location (or a refrigerator, if possible). This process takes several hours, so be prepared to leave the sample overnight. Do not apply heat to melt the sample as it encourages evaporation.
- If possible, periodically squeeze any extra air out of the bag until the sample is fully melted.
Collecting Rain Samples
If there’s rain in the forecast and windspeed is forecasted to be relatively low, it’s time to start planning for sample collection.
- Set aside two zip-top bags and rain funnels to be used for collection. Be sure to label your bags for easy reference.
- Be sure to add a weight to the bottom of your bottle funnel so it does not blow away during collection.
- Place the bag inside of the bottle on top of the weight, then insert the funnel to complete the set-up.
- Periodically check on the sample. Proceed to the next step once the bag is 1/4 to 1/3 full, or once precipitation stops, whichever comes first.
- Remove the funnel and close the bag, squeezing out as much air as possible.
- Store the sample away from direct sunlight in a cool, dark location (or a refrigerator, if possible) until you are ready to transfer the samples to the vials.
Sample Transfer and Storage
Once the sample has been collected, it must be transferred to the provided vials, dated, and properly stored until shipment.
- Transfer the collected liquid to the designated sample vial using the syringe. Fill the vial until it is nearly overflowing before putting on the cap. If there are any air bubbles in the sample, carefully remove the lid and top it up with a couple more drops from the syringe.
- Tighten the lid and secure with a piece of tape.
- Complete these two steps again for the second sample, making sure to fully empty the plastic syringe between each transfer.
- Mark the vials with the date the samples were collected.
- Store the vials in a cool, dark location (i.e., a refrigerator or cupboard) until shipment.
Filling Out the Data Sheet
You can access the online data sheet here: https://forms.gle/Kz8Tj43YxwLat3zJ7
No detail is too small! It is always better to have more data than you might need, so include as much information as you can for each section of the form.
Important: be sure the sample number on your vial is included in the data sheet.